Methods
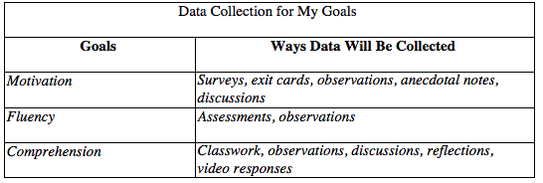
To better understand how Reader’s Theater affects fluency, motivation, and comprehension, I used various types of methods to collect and analyze data. I was looking for information to understand what the students were experiencing and to guide my decisions regarding reader’s theater in my classroom.
Data Collection
Surveys:
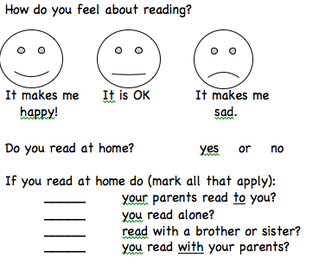
The survey in Appendix A was the first step in collecting data for my research. The questions focused on information in five areas: attitude towards reading, what things motivate the child, the kinds of reading enjoyed, the current frequency of reading, and their prior experience with plays. Understanding each child’s motivation, frequency of, and attitudes towards reading helped guide me in my research. The survey was given to all the students in my classroom during the first week of school and again at the end of my study. It was also used to create a focus group of students. Types of questions included rankings, fixed response, open-ended, and ratings. As part of the survey, students drew a picture of what they enjoyed most at school. Open-ended questions such as this allowed students to give meaningful answers using their own feelings. I hoped to learn through this survey what changes students experienced towards reading (attitude, motivation, and frequency) from the beginning of my research to the end. Example questions were:
Interviews and Discussions:
A second method of data collection that I used was interviews. Students were interviewed in small groups, individually, and as a whole class. All the students had a chance to be interviewed at some point during my research. I had originally planned on having a small focus group (4-5 students), but found that I really wanted to hear the opinions and ideas of everyone. We met regularly to reflect on the process and experience of Reader’s Theater. Occasionally I met with students individually to clarify information, or in groups to see how they viewed topics. Example questions were: What do you like about RT? Is there anything you would change? Who would you like to have as your audience? Most questions that I asked were based on what I was observing and hearing in the classroom. It was through interviews and discussions that I was able document their experiences with Reader’s Theater, motivation, and changes in attitude.
Work Samples & Reflections:
Work samples were another method for collecting data. A beginning and end of study reading assessment was given to all students. This helped me look at changes in fluency, motivation, and comprehension over time. Reading unit assessments and fluency assessments were also given periodically. Students also showed their ability to apply comprehension skills throughout the curriculum by completing different kinds of assessments, such as flip books that showed sequencing, comic strips with the beginning, middle, and end of stories illustrated, and written responses.
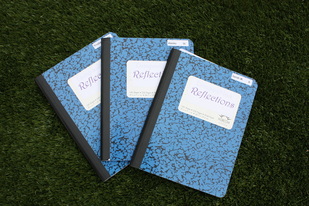
I also collected written reflections from all students, found in Appendix C and D. I started by having the students draw a picture to a prompt read by me. Then, as their reading improved, I read the reflection questions and they answered them with illustrations or sentences. At the end of my research, they were able to read and respond to the questions independently. Questions included: How did you feel performing in front of the class? What was your favorite part of the performance? What can we do to make the next performance even better? What part of Reader’s Theater do you like best? I also used video recording for reflections to let the students verbally reflect on their experience and show comprehension of their script, without having to get caught up with writing it down. At this age, writing detailed responses can be difficult, due to limited ability to write. Expressing themselves verbally was much easier when it came to explaining their thinking and understanding.
Observations/Anecdotal Notes:
My final method of data collection was observations and anecdotal notes. These were recorded on a biweekly basis. I was observing various behaviors that showed motivation, fluency, and comprehension throughout the day, related to the following questions. Were they choosing to read during their spare time? Were they returning books daily so they could get another book to read? Were they engaged when being read to? Did they practice reading without encouragement? Did they use expression when reading across the curriculum? What were their interactions with peers and general attitudes towards reading? Did they discuss stories they had read? I also took anecdotal notes throughout the study, which I recorded in my journal.
A second method of data collection that I used was interviews. Students were interviewed in small groups, individually, and as a whole class. All the students had a chance to be interviewed at some point during my research. I had originally planned on having a small focus group (4-5 students), but found that I really wanted to hear the opinions and ideas of everyone. We met regularly to reflect on the process and experience of Reader’s Theater. Occasionally I met with students individually to clarify information, or in groups to see how they viewed topics. Example questions were: What do you like about RT? Is there anything you would change? Who would you like to have as your audience? Most questions that I asked were based on what I was observing and hearing in the classroom. It was through interviews and discussions that I was able document their experiences with Reader’s Theater, motivation, and changes in attitude.
Work Samples & Reflections:
Work samples were another method for collecting data. A beginning and end of study reading assessment was given to all students. This helped me look at changes in fluency, motivation, and comprehension over time. Reading unit assessments and fluency assessments were also given periodically. Students also showed their ability to apply comprehension skills throughout the curriculum by completing different kinds of assessments, such as flip books that showed sequencing, comic strips with the beginning, middle, and end of stories illustrated, and written responses.
I also collected written reflections from all students, found in Appendix C and D. I started by having the students draw a picture to a prompt read by me. Then, as their reading improved, I read the reflection questions and they answered them with illustrations or sentences. At the end of my research, they were able to read and respond to the questions independently. Questions included: How did you feel performing in front of the class? What was your favorite part of the performance? What can we do to make the next performance even better? What part of Reader’s Theater do you like best? I also used video recording for reflections to let the students verbally reflect on their experience and show comprehension of their script, without having to get caught up with writing it down. At this age, writing detailed responses can be difficult, due to limited ability to write. Expressing themselves verbally was much easier when it came to explaining their thinking and understanding.
Observations/Anecdotal Notes:
My final method of data collection was observations and anecdotal notes. These were recorded on a biweekly basis. I was observing various behaviors that showed motivation, fluency, and comprehension throughout the day, related to the following questions. Were they choosing to read during their spare time? Were they returning books daily so they could get another book to read? Were they engaged when being read to? Did they practice reading without encouragement? Did they use expression when reading across the curriculum? What were their interactions with peers and general attitudes towards reading? Did they discuss stories they had read? I also took anecdotal notes throughout the study, which I recorded in my journal.
Data Analysis
Surveys:
The data I collected using my survey was analyzed to pull out themes related to attitude towards reading, motivation, kinds of reading enjoyed, the frequency of reading, and prior experiences with plays. A mix of open, closed, and ranking questions were used. This data was kept on a chart using tallies. Graphs were used to show the change over time in each of these areas. For the closed questions I graphed the different responses. Open-ended questions were used to understand and look for change over time with regard to motivating factors in reading. The pictures they drew gave insight to how they felt about school. Ranking questions assisted me in understanding more about their reading preferences.
Interviews and Discussions:
In order to analyze the data from my interviews and discussion, I transcribed or logged them. I looked for trends or changes in motivation and attitudes towards the use of Reader’s Theater. I used quotes or ideas that signaled increases in motivation, fluency, and comprehension, and those that did not. This was a good indicator as to which types of stories and/or type of Reader’s theater had a positive impact on readers. I also noted key ideas that might help guide future data collection and how I used reader's theater in the classroom and across the curriculum.
Work Samples & Reflections:
Data collected through work samples was used to explore growth in comprehension, changes in motivation, and fluency. The initial Developmental Reading Assessment 2 (DRA2) gave a beginning point for each student in reading, comprehension, and attitude towards reading. The results were analyzed based on accuracy, fluency, and comprehension. This information from my class was graphed and change over time was observed. Throughout the study fluency rates and prosody (expression and phrasing) were checked using our current reading program’s assessment. This included small reading passages that measured words per minute and prosody. While fluency rates can be graphed over time, prosody is more subjective and was documented using anecdotal notes. Reflective journals used after each performance provided data about attitudes towards reading and personal reflections about their performance.
Observations/Anecdotal Notes:
Observations were recorded using digital audio recorders, video, and written notes. Relevant parts were transcribed and kept in a journal or a log. My journal also included biweekly reflections about students, their choices, and motivation. Anecdotal notes were also kept in my journal. I used this information to help me prepare for my next steps and come up with questions that helped guide my research. I also used this information to better understand trends about motivation, comprehension, and fluency that were emerging from the other data sources.
